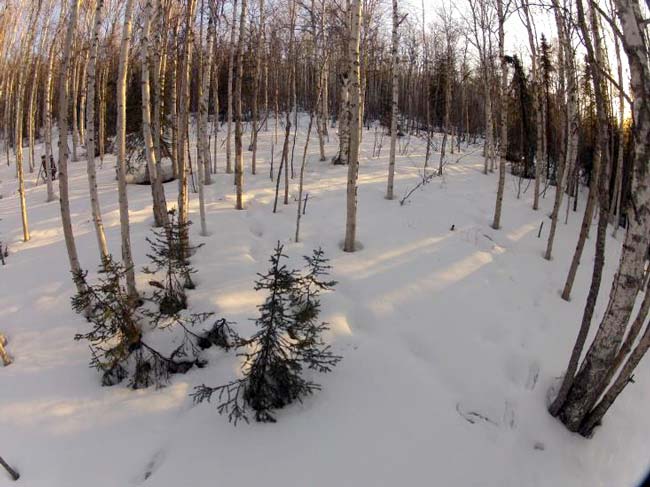
Image above: A GoPro camera installed at the Caribou Poker Creek watershed provides observations of spring snow cover fraction (SCF) for validation of MODIS remotely sensed SCF being ingested into the AK Pacific River Forecast Center’s model forecasting framework..
Photo Credit: Katrina Bennett.
Climate change will shift the frequency, intensity, duration and persistence of extreme hydro-climate events and may have particularly disastrous consequences in vulnerable systems such as the warm permafrost-dominated Interior region of Alaska. This presentation focuses on historical data analysis using recent research results from non-parametric trends and nonstationary generalized extreme value (GEV) analyses at eight Interior Alaskan river basins for 1950-2012. Maximum and minimum streamflow trends indicates a strong (> +50%) and statistically significant increase in 12-day flow events during the late fall/winter and during the snowmelt period (late April/mid-May), followed by a significant decrease in the 12-day flow events during the post-snowmelt period (late May and into the summer). The March-April-May seasonal trends illustrate significant decreases (> -50%) in maximum streamflow in snowmelt systems, while summer declines dominated in glacial-nival basins, highlighting the importance of analyzing trends across multiple time scales. Annual maximum streamflow trends indicate that most systems are experiencing declines, while minimum flow trends are primarily increasing. Nonstationary GEV analysis identifies time-dependent changes in the distribution of winter and spring extremes, which may be indicative of shifting regimes linked to temperature increases or large-scale modes of climate variability. Springtime maximum flow increases are apparent on mixed glacial-nival basins (representative of increasing baseflow and time-shifting freshets), while declines in maximum streamflow occur in nival-dominated watersheds in relation to precipitation- /temperature-forced climate variability. Future global climate model projections for maximum temperatures indicate increased frequency of warming, particularly under the RCP 8.5 scenario.