Just click the “Plot “ button on the lower right side, and you will see a graph.
You can change the units at the upper right from ºF to ºC.
You can change the units at the upper right from ºF to ºC.
Installation |
Battery replacement |
About the sensors
|
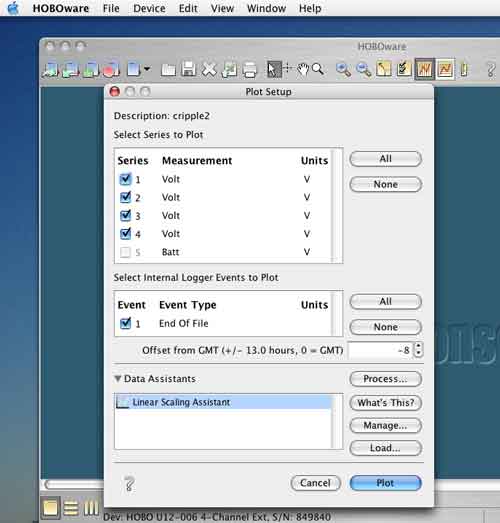
| Once you have successfully downloaded the data the screen should automatically open the following screen. | ||
|
||
Just click the “Plot “ button on the lower right side, and you will see a graph. You can change the units at the upper right from ºF to ºC. |
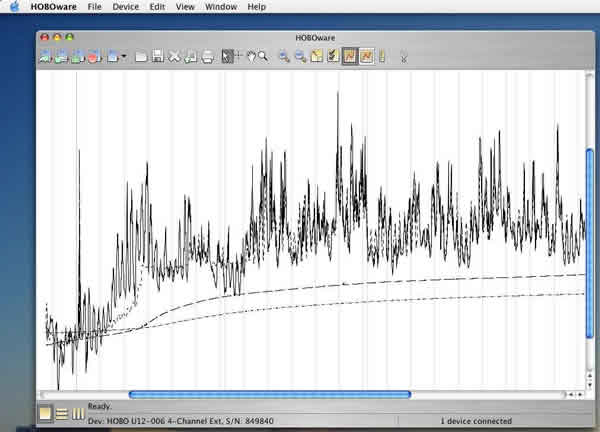 |
The generated graph might be hard to figure out at glance. It shows 4 different lines from 4 different depth (in most cases). Each line shows the temperature change at a certain depth. Once we receive your data, we will send you a more useful version of the plot. |