Frost Tube Protocol
Purpose
To monitor the timing and
depth of freezing in soil at a Frost Tube Site or a designated GLOBE Study Site.
Overview
Students will construct a
Frost Tube that is inserted into a hole in undisturbed and uncompacted soil.
During the cold months, students measure the depth at which water in the Frost
Tube has frozen, indicating that the surrounding soil has also frozen.
Student Outcomes
Students will be able to,
Science Concepts
Earth and Space Sciences
Life Sciences
·
The temperature of the soil will
impact the type of life growing on and in it and how it grows. (Organisms’
functions relate to their environment.)
·
The type of vegetation growing on
soil can influence how deep soil freezes and thaws as well as the rate at which
it freezes and thaws. (Organisms change the environment in which they live.)
Scientific Inquiry Abilities
·
Use appropriate tools
and techniques including mathematics to gather, analyze, and interpret data.
Time
Construction of Frost Tube:
1 – 2 hours
Selection of site, set up
and installation of Frost Tube: 1 - 2 hours
Visits to and from site: 10
minutes (5 minutes to the site and 5 minutes to return)
Time to read measurements:
5 minutes
Level
All
Frequency
Depth of frozen ground is
measured at the same time of day (preferably within one hour of solar noon) once
a week beginning when air temperatures approach freezing (0°C).
Materials and Tools
Frost
Tube Site Definition Field Guide
Frost
Tube Site Definition Sheet
Frost
Tube Field Guide at Air Temperatures Warmer Than -20 C
Frost
Tube Field Guide at Air Temperatures Colder Than -20 C
GPS
Protocol Field Guide (if using a new site)
GPS
Protocol Data Sheet (if using a new site)
GPS
receiver (if using a new site)
Soil auger (Needed once for
installation)
Preparation
Select a site for
installing your frost tube. Ideally, the site should be in relatively
undisturbed and uncompacted soil in native vegetation and within 30 meters of
your Atmosphere study site if you have one.
Check with appropriate authorities
for safety in digging in soil at the selected site.
Obtain a GPS reading of the
Frost Tube Protocol study site.
Prerequisites
GLOBE GPS Protocol
Recommended
GLOBE Soil Temperature Protocol
GLOBE Soil Characterization Protocol
GLOBE Atmosphere Protocol (air and soil temperature; precipitation)
Introduction
Why Study Frozen
Ground?
The temperature of the soil
is an important measurement to understand because it affects
microclimate, plant growth, the timing of budburst or leaf fall, the rate
of decomposition of organic material, and other chemical, physical, and
biological processes that take place in the soil. In general, the pattern of
soil temperature over the course of a year tends to stay about the same (e.g.,
the mean summer soil temperature, mean winter soil temperature, and mean annual
soil temperature stays relatively constant from year to year). However, if a
change in mean summer, winter, or annual soil temperature occurs from one year
to the next, it could be due to some significant change in the surrounding
environment such as an increase in air temperature due to global warming or some
type of disturbance such as deforestation, removal of the insulating soil
surface, or urbanization.(see the GLOBE soil temperature protocol for more
information about soil temperature). Monitoring the timing and depth of soil
freezing and thawing helps scientists to understand how the temperature of the
soil is changing over time so that they can identify the effect of climate
change such as warming or other
disturbances on the ecosystem.
At mid-latitudes and
mid-elevations on the Earth, parts of the soil near the surface freeze in the
winter. In Northern and Southern latitudes and at high elevations, some soil
layers/earth materials that remain at or below 0 C for at least two consecutive
years are known as permafrost (http://www.uspermafrost.org/glossary.php). The
soil frost tube protocol allows GLOBE students and scientists to see what part
of the soil freezes and when the freezing starts and ends in different parts of
the world. If, after some disturbance or because of climate change, the soil
temperature over the year may be warmer, the depth of soil freezing may
decrease, and the time of freezing may be delayed. Other parts of the
environment will also be affected. In cold climates, large amounts of organic
matter (dead plants and animals) are present in the soil and become locked up in
the permafrost. As the permafrost thaws, the organic matter starts to decompose
and greenhouse gases such as carbon dioxide and methane are released. An
increase in greenhouse gases in the atmosphere leads to higher air temperatures,
which leads to even warmer soil temperatures, more thawing of permafrost, and
the release of even more greenhouse gases as more organic material decomposes.
This positive feedback cycle continues to add to global warming once it starts.
The surface layers over the soil become thinner and have less insulating
ability, and trees that were growing over the frozen soil layers with high ice
content fall over and look like a “drunken forest”. The types of vegetation
will be affected by the changing hydrologic regimes.
What is Permafrost?
Permafrost
is a
layer of soil or rock, at some depth
beneath the surface, in which the temperature
has been continuously below 0°C for at least two years or more; it exists where
summer heating fails to reach the base of the layer of frozen
ground (National Snow and Ice Data Center http://nsidc.org/cgi-bin/words/word.pl?permafrost
). In areas where air temperatures rise above freezing for a few months of the
year, the ground surface may temporarily thaw before freezing again after the
arrival of cooler weather. The layer of soil above permafrost that seasonally
freezes and thaws is called the active
layer. The thickness of permafrost and the active layer depend on local climate
conditions, vegetation cover and soil properties as well as from heat within the
Earth.
As air
temperatures cool (e.g. fall going into winter) the layer of freezing in the
soil should increase but other variables such as snow depth and the thickness of
the vegetative layer will impact how much and how quickly freezing occurs. If
the layer of snow and or vegetation is very thick, it will insulate the soil and
prevent it from freezing until later in the winter. When there is heavy snowfall
early in the year and it persists, it will delay ground freezing. The maximum
freeze in undisturbed soil generally occurs in late winter or early spring when
air temperatures are starting to warm up. In the same way, the depth of thawing
in permafrost areas is usually deepest at the end of the summer or even after
the first few frosts in early autumn.
Figure 1.
Permafrost extent in the Northern
Hemisphere
Brown, J., Ferrians, O.J.J., Heginbottom, J.A. and Melnikov,
E.S. (1997). International Permafrost Association Circum-Arctic Map of
Permafrost and Ground Ice Conditions, Scale 1:10,000,000.
Permafrost zones occupy up to 24 per cent of the exposed
land area of the Northern Hemisphere. Permafrost is also common within the vast
continental shelves of the
The Big Picture
The
temperature of soil is directly linked to the temperature of the atmosphere
because soil is an insulator for heat flowing between the solid earth and the
atmosphere. For example, on a sunny day, soil will absorb energy from the sun
and its temperature will rise. At night, the soil will release the heat to the
air having a direct and observable effect on air temperature. The amount of heat
that will be absorbed or released by the soil from and to the atmosphere depends
on a number of factors including topography, vegetation cover, organic matter
content, soil texture, soil bulk density, and soil moisture. A north facing
slope will be colder and more likely to freeze than a south facing slope in
northern latitudes. The type of trees or other vegetation growing on the soil
determines how much heat and light reach the soil below the vegetation canopy. A
more open canopy will let more heat and light in than a closed canopy.
A moss layer or organic matter in the soil acts as an insulator that
slows the transfer of heat to and from the
mineral parts of the soil. Wet soils heat more slowly than dry soils because the
water in the pore spaces between the soil particles absorbs more heat than air.
The denser the soil, the more heat is conducted through it so that a sandy soil
or a soil with a high bulk density
will conduct heat faster than a clay or loamy soil with good structure and low
bulk density.
As
the soil surface is impacted from disturbances such as changes in hydrology,
building roads, urbanization, cutting trees, or mining peat moss, the insulating
properties of the soil surface are removed and more heat and light move into the
soil, increasing it’s temperature and causing frozen layers to melt. As heat
leaves the soil surface, the water and minerals in the soil freeze from the top
down. However, as the air
temperature warms and the ice in the upper soil horizons melts, the melted water
moves through the soil and freezes again as it reaches the permafrost layer so
that the soil begins to freeze from the bottom up.
One
of the indications of permafrost presence is the presence of “patterned
ground”. These include polygon shaped features across the landscape and large
features called “pingos”, which form when the soil freezes and thaws over
many seasons Pingos have an ice core that is being pushed up by groundwater .
|
|
|
|
|
Figure 2. Patterned Ground (http://www.uspermafrost.org/glossary.php) |
|
|
What is a Frost Tube?
The
instrument used to measure the depth and timing of the freezing of the ground is
called a Frost Tube. This instrument is easily made and installed in undisturbed
soil near your school. The Frost Tube consists of a piece of 6-8 mm clear
plastic tubing (inner tube) marked in 5 cm increments holding colored water that
sits inside a 10 mm (outer diameter) radiant heat tube (middle tube) sealed on
the bottom. This is placed inside a 12 mm CPVC pipe(outer tube), open on both
ends

Figure 3. Components of a frost tube

Figure 4. Another view of the frost tube showing
inner, middle and outer tubes.
Teacher
Support
Depth
of soil freezing is related to the length of time it has been cold above ground.
That is why measuring the depth of freezing indicates the type of climate where
they study is. Monitoring the depth of soil freezing helps scientists and
engineers understand how the temperature of the soil is changing over time so
that they can identify the effect of climate change.
When
winter comes the ground freezes and the frozen soil becomes thicker as winter
progresses.. How thick will it become?
The
depth of ground freezing depends on many different parameters, such as freezing
degree days, soil moisture content, bulk density, grain particles, etc. This can
be simplified by the following formula:
D
=
aF
D = depth of freezing
a = constant
F = √t (square root of t) =
freezing degree days
F is the number of freezing degree days
at the ground surface. Freezing degree days (fdd) is a measure of how
cold it has been and how long it has been cold; the cumulative fdd is usually
calculated as a sum of average daily degrees below freezing for a specified time
period (10 days, month, season, etc.). (National
Snow and Ice Data Center http://nsidc.org/cgi-bin/words/word.pl?freezing%20degree-days
)
a is a constant of the thermal property
of the soil, soil moisture content and characteristics of frost heaving. Frost
heaving is characterized by soil particle size. a varies between 1 to 5 and is usually
around 2.7 but it strongly depends on location. For example, saturated sandy
material is around 3. Dry silty material is about 2.3. Organic material would
probably be around 2.
Using
depth of soil freezing and freezing degree days we can figure out a.
By knowing a
and climactic conditions (#freezing degree days, F) we can calculate the depth of
freezing, D.
If we know the frost depth and a then we can calculate freezing degree
days. In this way scientists can better understand how the climate may be
changing by gathering more data about soil freezing depth.

Figure
5. Progression of freezing
Who can do the Frost Tube Protocol?
First,
ask the following questions:
If
you answer yes to any of these questions, then this protocol is a worthwhile
investigation for your class. This protocol is a first step to helping students
investigate relationships among air, soil, snow
and permafrost (where it occurs).
Site Selection
Ideally,
the Frost Tube Study Site should be in relatively undisturbed and uncompacted
soil in an area of native vegetation. Since the results for this protocol could
be combined with temperature and precipitation data from a GLOBE Atmosphere
Investigation, try to choose a site close to the Atmosphere study site, if you
have one. It would also be best to locate your Frost Tube within a 5 minute walk
from your school so it is relatively easy to access in cold weather.
Because many soils in
northern latitudes were formed from glacial parent material, soils in this
region may contain many large rocks that may make it difficult to dig into. If
possible, locate an area with a minimum of rocks or you may need to use more
robust equipment for inserting the frost tube. Check with the appropriate authorities for permission to dig at your
proposed site and to locate it safely away from any buried cables or pipes.
Be aware that nearby buildings, roads and even lakes or rivers may influence
soil temperatures and affect the data you collect so carefully document this
information on the Frost Tube Site
Definition Sheet. If
you live in an area of permafrost, check the clear tube late in summer to
measure the distance from the soil surface to the boundary between water and ice
at the bottom of the tube. Enter this data in the Comments/ metadata section of
the Frost Tube Data Sheet.
Measurement Procedure
It
is highly desirable that these observations be done by a minimum of two people
per visit.
Students
will measure the depth of freezing as the ground cools.
·
Depth of Freezing = distance in the Frost Tube (inner tube) from the soil surface to the
boundary between the ice layer and unfrozen water. This represents the depth of
freezing between the soil surface and the underlying unfrozen soil.
Managing Students
It is
very important that someone visits the Frost Tube site every week to take
measurements once the air temperature drops below freezing. Students need to
collect measurements quickly and efficiently to reduce the impact of the
surrounding air temperature on the Frost Tube. When students are finished making
their observations they must replace the top cap to keep snow, water and cold
air out of the assembly.
Frequently Asked Questions
1. Where
is the deepest ice-water boundary in non-permafrost underlain areas?
The depth
of where the colored water ends and clear water begins is used as an aid to read
the ice-water boundary; however sometimes when the water in the inner tubing
freezes and thaws, the color or dye is pushed out of the frozen portion, and
even when it thaws and refreezes, the color does not go back. So bend the tube
to detect or locate presence of ice.
Frost Tube Protocol – Looking
at the Data
Are the data reasonable?
The
freezing front (boundary of ice and water interface) usually moves very slowly
from the soil surface down (less than 1 cm per day). However if below freezing
air temperatures persist and there is no snow cover, near surface soil depth
freezing could happen quickly in the top 5-10 cm of soil early in the winter
depending on soil water content and ambient air temperatures. This typically
happens in permafrost underlain regions such as in Interior Alaska.
In either case, freezing usually proceeds at increasing depths in most of
the Alaska, but not southeast or Prince William Sound area.
What do scientists look for in
the data?
Frost
tube (depth) can tell many things. The maximum depth of freezing would be one of
the important measurements for this. Ground freezing mostly depends on air
temperature, snow depth, and soil properties. Severe winter conditions in one
area could result in deeper soil freezing than warmer winter conditions in
another area. Delay in ground freezing could be captured by frost tube data.
Delay in ground freezing directly affects degradation of the permafrost in
northern latitudes.
Also snow
thickness is an important factor in ground freezing because of snow’s
insulating quality. Different freezing depths could result in areas with the
same air temperature but with different snow depths
These
differences in ground freezing depths can be simulated or modeled once soil
conditions or characteristics (designated as “a” in the equation given
earlier in the Teacher Support section), is calculated. Freezing degree days
(accumulated daily average surface ground temperatures colder than 0 ˚C)
increases until the end of the winter. Snow depth and air temperature affect
freezing degree days (fdd) and ground-freezing depth. However “a” stays the
same. Hence we can predict depth of freezing (D) using fdd. Depth of ground or
soil freezing (“D” in equation) can be estimated from one year of frost tube
data.
Estimating
soil frost depth: Calculating freezing degree days (FDD):
The
maximum depth of freezing depends on winter air temperature, snow thickness,
soil moisture content, soil physical properties, such as grain size, pore space,
mineral composition etc. Freezing degree days (fdd) at ground surface are a
common measure of freezing depth estimation used by scientists. For this method,
you will need the daily average ground surface temperature data for your school
from September 1st (if you live in the northern hemisphere) or April first (if
you live in the southern hemisphere) up to and including the date of when
temperatures are above freezing ( 0 oC).
To
calculate freezing degree days:
1.
First, for each day, calculate the daily average ground temperature (Tavg)
2.
Starting with September 1 or April 1, check to see if Tavg is less than 0˚
C. If it is, record this temperature. If Tavg is greater than 0˚ C, ignore
it. Go to the next day. Again, check to see if the (Tavg) is less than 0˚
C. If it is, add it to the temperature you recorded for the first. If not, again
ignore it. Repeat this process for each subsequent day up to the day of no
freezing (e.g. until late spring). The sum of the daily average negative
temperatures is your freezing degree days (fdd unit is “°C
days”). But remove negative sign (-) from sum of the daily average of negative
temperatures. Freezing degree days does
not include minus (-) sign before number. Record values in the Table on your Work
Sheet.
|
|
Tavg |
FDD
by day |
FDD |
frost
depth |
Tavg |
FDD
by day |
FDD |
frost
depth |
|
|
Homer |
Homer |
Homer |
Homer |
Igiugig |
Igiugig |
Igiugig |
Igiugig |
|
10/1/08 |
2 |
0 |
0 |
|
nd |
nd |
nd |
|
|
10/2/08 |
1 |
0 |
0 |
0 |
nd |
nd |
nd |
0 |
|
10/3/08 |
1 |
0 |
0 |
|
nd |
nd |
nd |
|
|
10/4/08 |
0 |
0 |
0 |
|
nd |
nd |
nd |
|
|
10/5/08 |
0 |
0 |
0 |
|
nd |
nd |
nd |
|
|
10/6/08 |
0 |
0 |
0 |
|
nd |
nd |
nd |
|
|
10/7/08 |
-1 |
1 |
1 |
|
nd |
nd |
nd |
|
|
10/8/08 |
-1 |
1 |
2 |
|
nd |
nd |
nd |
|
|
10/9/08 |
-1 |
1 |
3 |
|
nd |
nd |
nd |
|
|
10/10/08 |
-1 |
1 |
4 |
|
nd |
nd |
nd |
|
|
10/11/08 |
4 |
0 |
4 |
|
nd |
nd |
nd |
|
|
10/12/08 |
2 |
0 |
4 |
|
nd |
nd |
nd |
|
|
10/13/08 |
0 |
0 |
4 |
|
nd |
nd |
nd |
|
|
10/14/08 |
0 |
0 |
4 |
|
nd |
nd |
nd |
|
|
10/15/08 |
0 |
0 |
4 |
|
2 |
0 |
0 |
|
|
10/16/08 |
0 |
0 |
4 |
|
-2 |
2 |
2 |
|
|
10/17/08 |
1 |
0 |
4 |
|
-4 |
4 |
6 |
|
|
10/18/08 |
1 |
0 |
4 |
|
2 |
0 |
6 |
|
|
10/19/08 |
0 |
0 |
4 |
|
-2 |
2 |
8 |
|
|
10/20/08 |
0 |
0 |
5 |
|
-4 |
4 |
12 |
|
|
10/21/08 |
-1 |
1 |
5 |
|
-2 |
2 |
14 |
|
|
10/22/08 |
-1 |
1 |
6 |
|
-6 |
6 |
20 |
|
|
10/23/08 |
-1 |
1 |
8 |
|
-6 |
6 |
26 |
|
|
10/24/08 |
-3 |
3 |
11 |
|
-6 |
6 |
33 |
|
|
10/25/08 |
-4 |
4 |
15 |
|
0 |
0 |
33 |
|
|
10/26/08 |
-2 |
2 |
17 |
|
-4 |
4 |
37 |
|
|
10/27/08 |
|
4 |
21 |
|
-9 |
9 |
46 |
|
|
10/28/08 |
-6 |
6 |
28 |
-13 |
-9 |
9 |
55 |
|
|
10/29/08 |
-6 |
6 |
34 |
|
0 |
0 |
55 |
|
|
10/30/08 |
-5 |
5 |
39 |
|
2 |
0 |
55 |
|
|
10/31/08 |
-2 |
2 |
41 |
|
-4 |
4 |
59 |
|
|
11/1/08 |
-5 |
5 |
45 |
|
-3 |
3 |
62 |
|
|
11/2/08 |
-6 |
6 |
52 |
|
-5 |
5 |
67 |
|
|
11/3/08 |
-7 |
7 |
59 |
|
-10 |
10 |
78 |
|
|
11/4/08 |
-7 |
7 |
66 |
|
-10 |
10 |
88 |
-27 |
|
11/5/08 |
-5 |
5 |
70 |
-32 |
-7 |
7 |
95 |
|
|
11/6/08 |
-3 |
3 |
74 |
|
-4 |
4 |
99 |
|
|
11/7/08 |
-3 |
3 |
77 |
|
-7 |
7 |
106 |
|
|
11/8/08 |
-5 |
5 |
82 |
|
-2 |
2 |
108 |
|
|
11/9/08 |
-5 |
5 |
87 |
-37 |
2 |
0 |
108 |
|
|
11/10/08 |
-1 |
1 |
88 |
|
1 |
0 |
108 |
|
|
11/11/08 |
0 |
0 |
88 |
|
-2 |
2 |
110 |
-37 |
|
11/12/08 |
-1 |
1 |
89 |
|
-3 |
3 |
113 |
|
|
11/13/08 |
-3 |
3 |
91 |
|
-5 |
5 |
118 |
|
|
11/14/08 |
-4 |
4 |
96 |
|
-4 |
4 |
122 |
|
|
11/15/08 |
-4 |
4 |
100 |
|
-2 |
2 |
123 |
|
|
11/16/08 |
-5 |
5 |
104 |
|
-3 |
3 |
127 |
|
|
11/17/08 |
-2 |
2 |
106 |
|
-7 |
7 |
134 |
|
|
11/18/08 |
-5 |
5 |
111 |
|
-11 |
11 |
145 |
-36 |
|
11/19/08 |
-7 |
7 |
118 |
|
-12 |
12 |
157 |
|
|
11/20/08 |
-7 |
7 |
126 |
|
-15 |
15 |
172 |
|
|
11/21/08 |
-5 |
5 |
131 |
|
-18 |
18 |
190 |
|
|
11/22/08 |
-7 |
7 |
138 |
|
-14 |
14 |
204 |
|
|
11/23/08 |
-8 |
8 |
146 |
|
-10 |
10 |
214 |
|
|
11/24/08 |
-4 |
4 |
149 |
|
1 |
0 |
214 |
|
|
11/25/08 |
-1 |
1 |
151 |
|
-11 |
11 |
225 |
|
|
11/26/08 |
-3 |
3 |
154 |
|
-14 |
14 |
239 |
|
|
11/27/08 |
-4 |
4 |
158 |
|
-12 |
12 |
251 |
|
|
11/28/08 |
-2 |
2 |
160 |
|
-6 |
6 |
257 |
|
|
11/29/08 |
-1 |
1 |
161 |
-40 |
-10 |
10 |
267 |
|
|
11/30/08 |
-1 |
1 |
162 |
|
-21 |
21 |
288 |
|
|
12/1/08 |
-3 |
3 |
164 |
|
-13 |
13 |
301 |
|
|
12/2/08 |
-3 |
3 |
167 |
|
-3 |
3 |
304 |
|
|
12/3/08 |
-2 |
2 |
169 |
|
1 |
0 |
304 |
|
|
12/4/08 |
-1 |
1 |
170 |
|
2 |
0 |
304 |
|
|
12/5/08 |
0 |
0 |
171 |
|
2 |
0 |
304 |
|
|
12/6/08 |
0 |
0 |
171 |
|
1 |
0 |
304 |
|
|
12/7/08 |
0 |
0 |
171 |
|
-1 |
1 |
305 |
|
|
12/8/08 |
0 |
0 |
171 |
|
0 |
0 |
305 |
|
Excel Data Table of surface temperature and freezing degree days
from 10/1/2008 until 5/1/2009 is provided as a separate document.
In order to calculate freezing degree days students first examined
the temperature data to see if there were any dates with missing data during the
freezing period. They found only one – October 27, 2008, at Homer. For that
missing temperature on that date, they looked at the mean temperature for the
day before which is October 26, and the day after which is October 28. To
estimate the mean temperature on October 27, they performed a linear
interpolation, which is a technique often used by scientists to estimate the
values of missing data. The graph below shows the mean temperature data for
October 26 (-2 ° C) and October 28 (-6 °C). They drew a line connecting these two
points and then estimated the mean temperature for October 27 as -4 °C. Then
they calculated the freezing degree days at Homer.

Figure 6. Estimate of missing datum for surface temperature on
October 27, 2008, at Homer.
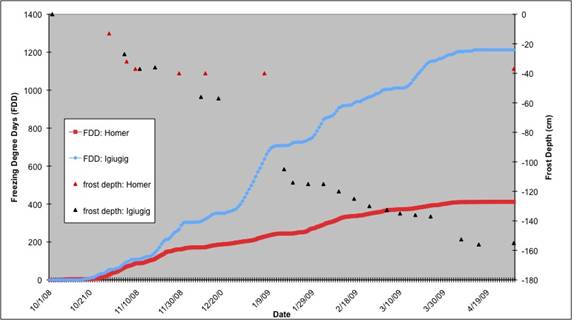
Next they calculated the freezing
degree days for Igiugig. They calculated the freezing degree days of 411 FDD at Homer
and 1212 FDD at Igiugig. Data show that the
site with greater number of freezing degree days, had deeper ground freezing,
155 cm depth at Igiugig; and the site with less number of freezing degree days, Homer, had
shallow ground freezing of 37cm depth. Also
number of freezing degree days and frost depth indicated thicker (more) snow
accumulated after November at Homer, that prevented further ground freezing,
hence, ground temperature stayed near 0°C
for the rest of the winter.
Figure
7. Freezing degree days and frost depths at Homer and
Questions for Further
Investigation
How will
frost depth differ in different regions across the globe?
What
would cause the timing and depth of freezing in soils to change from one year to
another?
How does
the depth of freezing affect vegetation phenology in a particular region?
Is there
any relationship between the freezing of the ground and freshwater ice
seasonality?
What
other parts of the ecosystem are affected by the timing and depth of soil
freezing?
References
Brown, J., Ferrians, O.J.J.,
Heginbottom, J.A. and Melnikov, E.S. (1997). International Permafrost
Association Circum-Arctic Map of Permafrost and Ground Ice Conditions, Scale
1:10,000,000.
Permafrost
extent in the Northern Hemisphere. (June 2007). In UNEP/GRID-Arendal Maps
and Graphics Library. Retrieved 05:55, May 26, 2010 from http://maps.grida.no/go/graphic/permafrost-extent-in-the-northern-hemisphere