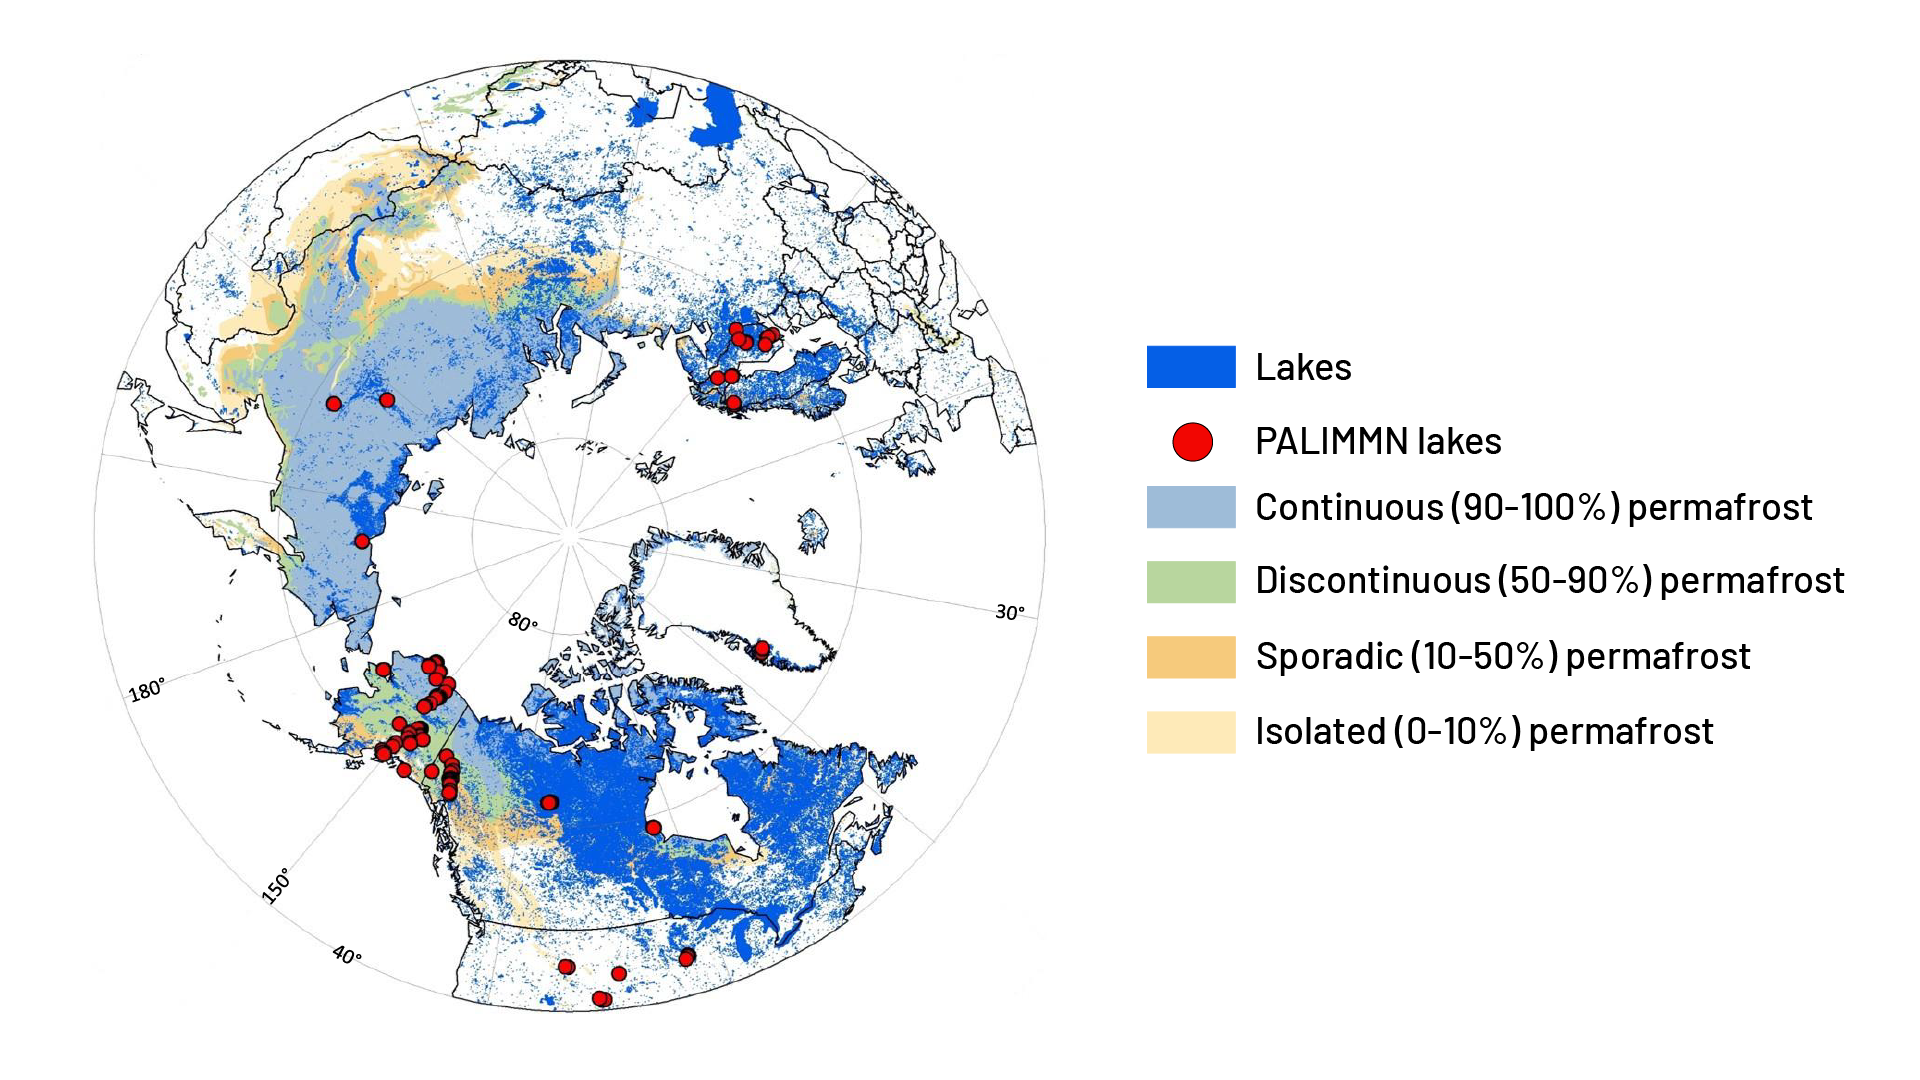
Polarview map showing the circumpolar extent of permafrost and lake rich regions. Red dots indicate PALIMMN lakes.
Data references
Lakes from Global Lakes and Wetlands Database, Lehner, B. and Doell , P. (2004): Development and validation of a global database of lakes, reservoirs and wetlands. Journal of Hydrology 296/1 4: 1 22.
Permafrost from permaice , Brown, J., O.J. Ferrians , Jr., J.A. Heginbottom , and E.S. Melnikov. 1998, revised February 2001. Circum arctic map of permafrost and ground ice conditions. Boulder, CO: National Snow and Ice Data Center. Digital media.
The purpose of PALIMMN is to create a network of observations on methane emissions from lakes around the globe by
The methodology originated in Arctic lakes because of the fast, cold freezing conditions of lakes in early winter that make the surveying easy; however, mapping methane bubbles can be done on any lake in the world that forms ice that is safe enough to walk on.
Please keep safety in mind! Read about lake ice safety!
A large network of observations will improve knowledge about the magnitude and variability in methane emissions from lakes around the world. This information can be used by climate modelers to better predict the response of methane production in lakes as a feedback to climate warming.
The chemical formula for methane is CH4. That means that one carbon atom and four hydrogen atoms are bonded together to form a methane molecule.
Methane is a greenhouse gas. It is released from lakes and wetlands all around the world. At the University of Alaska Fairbanks we focus on finding out how much methane is emitted from lakes to better understand their role in the global methane budget.
Methane bubbles from the bottoms of most lakes around the world. Methane is produced as a result of organic matter decomposition by microbes in anaerobic (without oxygen) sediments. Bubbling, also known as ebullition, often represents more than 50% of a lake's total emissions. Capturing the spatial dynamics of bubbling in lakes has been a challenge, resulting in an underestimate of lake methane emissions. By studying patterns of methane bubbles trapped in winter lake ice, we can quantify the patchiness of bubbling and determine more accurately how much methane is released from lakes.
With the PALIMMN dataset our goals are to:
You can help researchers know how much methane is evading lakes through bubbling and how they contribute to global climate change. The data you'll collect are scientifically valuable data that are going to be used in research as part of an International Polar Year Project. Survey the lake in your backyard, become a member of PALIMMN! Your data matters, experience the thrill of getting involved in a research project! Map and compare your data with others', and contribute to climate change study from where you are, with your students, family or friends.
In regions where lakes freeze, you can map methane bubbles in lake ice. You can also build bubble traps to collect the gas for flammability testing and laboratory analysis. Bubble traps can also be deployed in lakes that do not freeze; however, without ice, it is not possible to map the distribution of methane seeps on lakes.
Here is how to become a PALIMMN participant
Forms are available on the instructions page.
Your school or research team will receive recognition for the data you send in. More importantly you will be contributing to all of our understanding of the importance of methane in global warming.
As an educator you will have access to lessons plans that guide your students through indoor and outdoor acitivies. These plans can be adopted to a range of school curricula.
If you are interested in helping with PALIMMN, please read more in the instructions section.