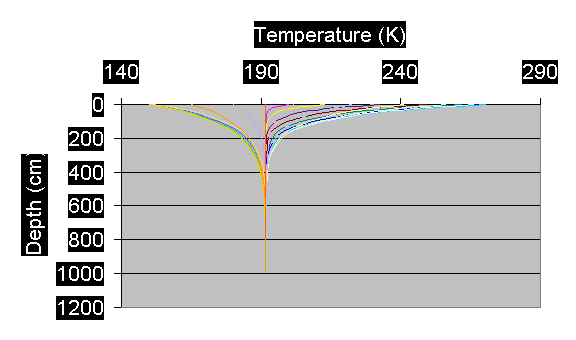

Figure 1. Simulated annual temperature profiles (2,592,000 second time interval) at various depths in Martian polar region (edge of the Polar cap).
Figure 2. Polygonal pattern observed from the Mars orbiter and aerial photography (a,b: MOC2-189, c:MOC2-150, d: Barrow Alaska).

